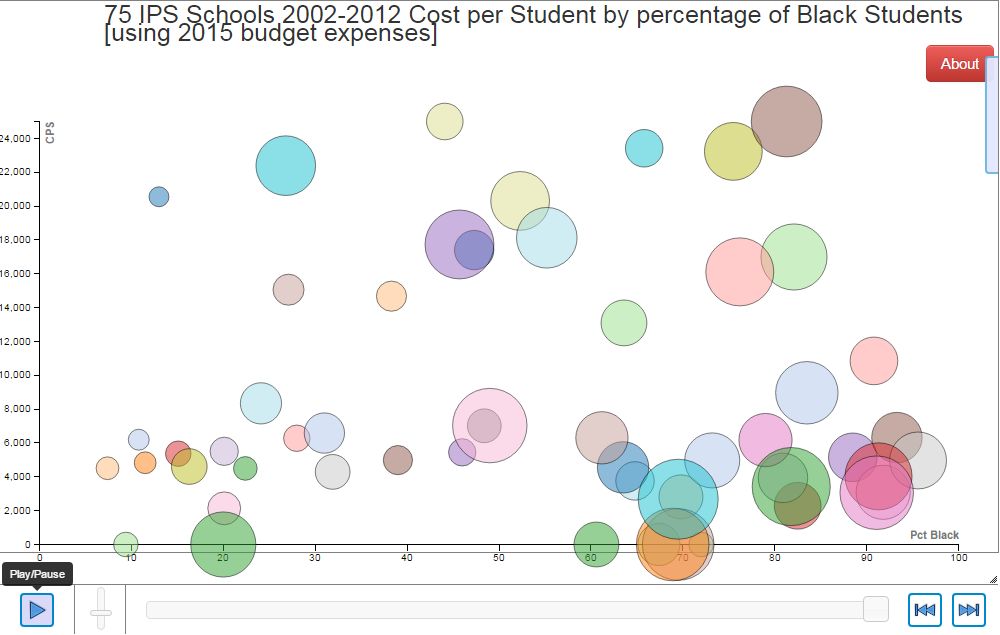
Mostly Separate & Definitely Unequal: Indianapolis Public School's Allocation of Funding by Demographics 2003-2015.
While 61% of the total is allocated to the General Fund, only 42% of this can be traced back to individual schools (with publicly available data), the remaining expenses are "Central Office Expenses".
It is our contention that in the absence of data, Black students are not receiving equitable application of these resources. The lack of data that is "disaggregated" [a political term] by school makes proving disparities between schools or subgroups within a school district difficult. Several people provided comments to legislators in 2015 to require school districts to provide greater detail of financial and operational data to the public. Having said this, in the true spirt of Data ("that which is given"), let's explore the data available.
Looking at the data that is tracable to indivdual schools, 78% of Black students attended 41 schools having percentage of Black students exceeding 50%. These schools only received about half of the operating budget. These 41 schools have 60% of total enrollment yet are only budgeted 54% of expenses and FTE staff! The cost per student analysis confirms the disparity. This condition has persisted over the period reviewed (2003-2015).